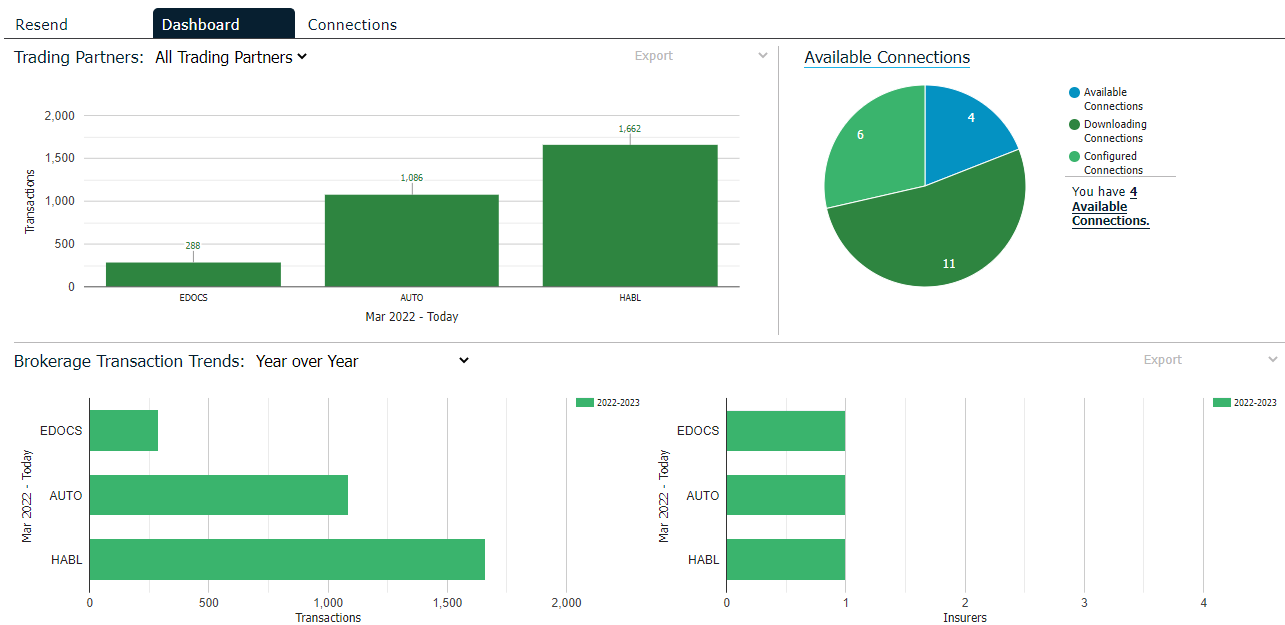
This Dashboard gives you a single location to view all of your brokerage's current download usage, connections opportunities, and relevant industry news.
The following charts are available here:
The Trading Partners chart shows the number of insurers transactions by month for the last twelve months. You can view these numbers for all insurers or for a specific company.
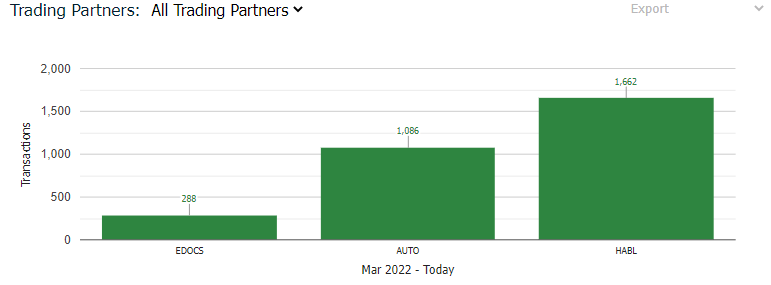
To view this data for a specific partner, choose the correct Trading Partner from the dropdown list.
To see this data broken down by insurer and line of business in a spreadsheet, click the Export dropdown arrow and select Past Year by Insurer. In the pop-up window that displays, click Open to view the information immediately or click Save to save the file locally.
The Available Connections chart shows the number of available connections, the number of configured connections, and the number of connections that your brokerage is currently downloading.
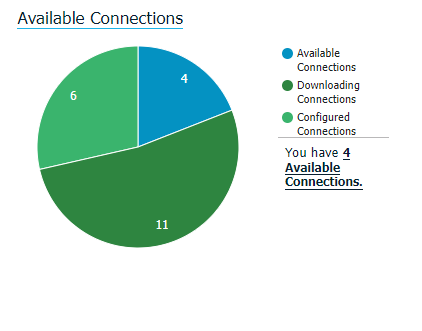
Hover over any of the percentages on the chart to view the raw numbers for that area.
Click the Available Connections link to switch to the Connections tab, which contains specific information by insurer.
This chart shows trends for the past year. In the Brokerage Transaction Trends dropdown menu, choose one of these options.
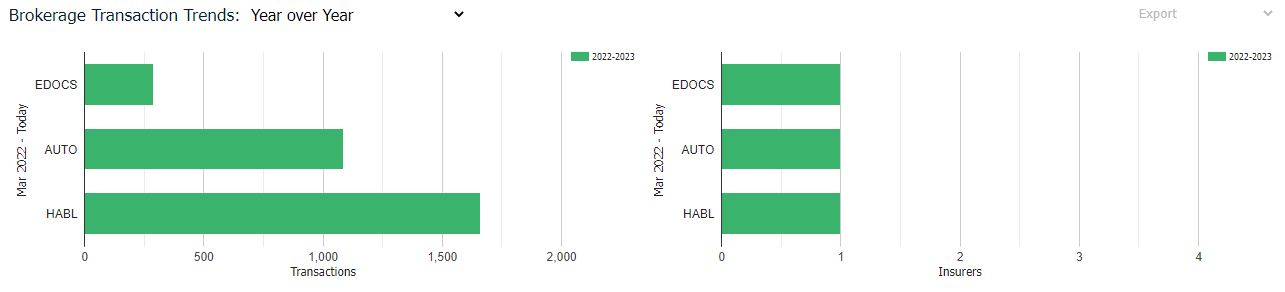
To see this data broken down further in a spreadsheet, click the Export dropdown arrow and select Past 3 Years or Past 3 Years by Year. In the pop-up window that displays, click Open to view the information immediately or click Save to save the file locally.